
Fighting Inflation: Maybe Monetary Policy Is Overrated
Economic policymakers have two broad tools for managing the business cycle and pursuing the goals of growth, full employment, and price stability: fiscal and monetary policy. While fiscal policy uses taxation and spending to direct resources to industrial policy, Keynesian stimulus, social services, redistribution, and the like, monetary policy seeks to maintain low inflation without stifling growth or contributing to unemployment, primarily through the adjustment of the policy interest rate set by the central bank.
Since the rational expectations revolution of the 1970s and ’80s, Keynesian ideas—such as the reliance on fiscal policy to boost effective demand through government-led investment—have fallen out of favour in comparison to less interventionist policies like passive fiscal policy and supply-side reforms (Blinder, 2022). However, this macroeconomic paradigm required a mechanism to manage periods of recession or economic overheating, leading economists to increasingly favour monetary policy over fiscal policy as the primary tool for managing the business cycle (Mishkin, 1995).
When investment and consumption fall and inflation is below target, central bankers intervene in the market by lowering the policy rate (the interest rate at which chartered banks borrow reserves from the central bank). This loosens monetary policy by making credit cheaper and more available and helps pull the economy out of a recession (Bank of England, 1999). Likewise, when aggregate demand is high and current output exceeds potential output (i.e., the economy is overheating), central banks raise interest rates. This tightens monetary conditions by raising borrowing costs, forcing banks to charge higher interest on loans and, eventually, to offer higher returns on deposits to compete for liquidity. This discourages consumption and investment on the margin while encouraging savings, thus lowering aggregate demand, output, and prices. When aggregate demand falls relative to supply, there is downward pressure on prices: this is the main mechanism by which raising interest rates is meant to curb inflation (Bank of England, 1999).
The post-pandemic inflation and its policy response
We recently witnessed monetary policy in action: during the deep COVID-19 recession in 2020, central banks around the world sent interest rates plummeting to stimulate consumption and investment; this was paired with expansionary fiscal policy. Inflation rose dramatically in 2021 and 2022, and central banks responded by raising interest rates from near zero in early 2022 to 5.25% in Canada, 4% in the Eurozone, and 5.3% in the US by mid-2023 (Federal Reserve Bank of St. Louis, n.d.-a, n.d.-b, n.d.-c). Inflation fell quickly in 2022: personal consumption expenditures inflation in the US peaked in January, and consumer price index (CPI) inflation peaked in June.
Many economists rushed to congratulate the Fed for bringing down inflation in the US. They believed that the post-pandemic inflation was primarily the result of a tight labour market, brought about by an overheated economy fuelled by the fiscal stimulus packages passed by the Trump and Biden administrations (call this demand-driven inflation). However, research from former Fed chair Ben Bernanke and former IMF president Olivier Blanchard (BB from now on) dispels this notion (Blanchard and Bernanke, 2023). They constructed an empirical inflation model, tested it out of sample, and used it to estimate the components of the post-COVID-19 inflationary surge. Their research suggests that a supply-driven theory of inflation better explains the data.
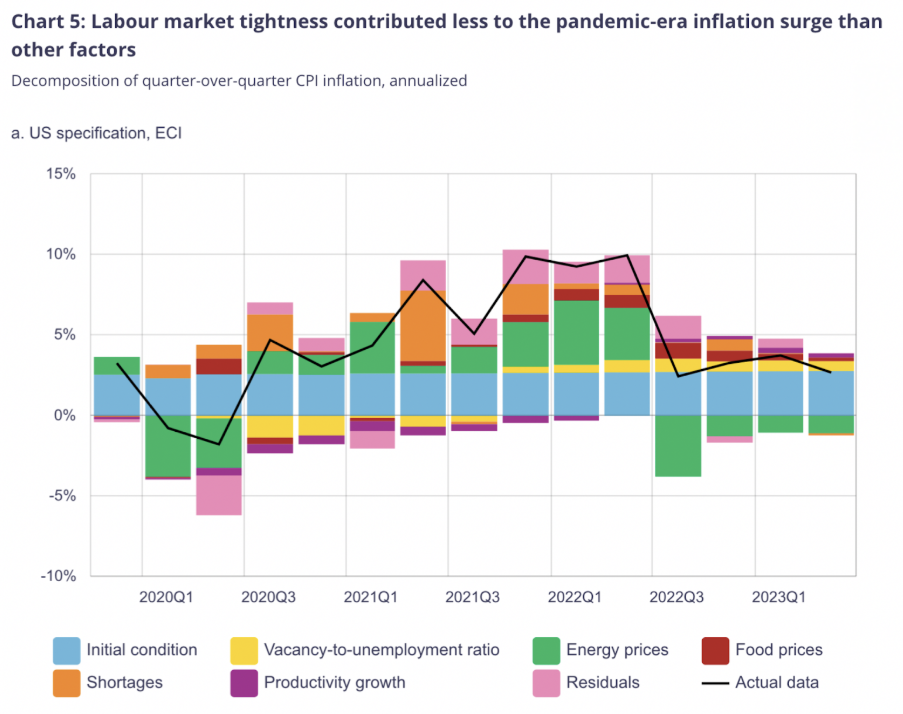
The graph below shows how different macroeconomic factors explain movements in the US inflation rate. Each coloured bar represents the marginal contribution of that factor to the inflation rate in each quarter. The black line represents actual observed inflation. The stacked bars (net of positive and negative contributions) represent the model’s fitted values. The pink residuals bar captures the difference between the model’s prediction and actual inflation. The graph was reproduced by Bounajm et al. (2024) at the Bank of Canada using BB’s model.
The following graph shows the same model but applied to Canada (Bounajm et al. 2024):

BB’s research challenges the idea that expansionary fiscal policy and a hot labour market caused inflation. Instead, negative supply shocks, especially to energy, seemed to be the leading cause of inflation in the US and Canada. This tracks what economist James Galbraith (2023) wrote at the end of the inflationary period:
“[The price of oil] took a spectacular dive to just $20/bbl in early 2020, recovered to its pre-pandemic levels, and then briefly spiked to around $116/bbl in early 2022 before again returning to $80.55 in November 2022. In inflation-adjusted terms, the price of oil never reached levels prevailing as recently as 2014 (FRED 2022), yet from the low base of early 2020, the rate of change, and therefore the contribution of derivative fuels to the change in the consumer price index, was dramatic. It was, however, finished by June 2022, with price deflation setting in thereafter. In the interim, oil prices drove the gasoline component of the Consumer Price Index up by 154 percent from the low in March 2020 to the peak in June 2022, with indirect effects on food and all other sectors.”
Demand-driven versus supply-driven inflation
BB’s paper, which was published shortly after Galbraith wrote the above analysis, confirms his view that oil was a key source of post-pandemic inflation (and disinflation in 2022). If the post-COVID-19 inflation had primarily been caused by excess fiscal stimulus (i.e., had it been demand-driven), we would expect to see that reflected in BB’s results through a tight labour market. However, they show that labour market tightness contributed minimally to inflation and only began to do so in quarter four of 2023. (Economists Claudia Sahm [2024] and Preston Mui [2023] have argued that BB’s measure for labour market tightness overstates worker power and thus workers’ ability to induce a wage-price inflationary spiral.)
The policy response to inflation ought to depend on the cause of the inflationary episode; while monetary policy might be an appropriate response to demand-driven inflation, it is not a good tool for dealing with supply-driven inflation. Interest rate hikes are meant to cool down the economy by reducing investment and consumption; if anything, they’re likely to exacerbate the supply-side issues causing inflation, not ameliorate them (Stiglitz and Baker, 2022). This is particularly true for housing (which typically makes up over a third of CPI), where interest rate hikes can freeze up the market by discouraging people from moving and having to take on a new mortgage at a higher rate.
BB’s research offers two key insights. First, the post-COVID-19 inflationary surge was primarily driven by negative supply shocks rather than excess demand. Second, the sharp disinflation in 2022 is largely attributable to falling energy prices. While the disinflation coincided roughly with the beginning of the interest rate hikes, it’s implausible that such small changes in the interest rate in such a short period could have spurred the dramatic disinflation we witnessed. According to the governor of the Bank of Canada, the effect of monetary policy on inflation typically appears after a lag of 12-24 months (Macklem, 2023). Further, the price of crude oil began to decline in June of 2022 (Federal Reserve Bank of St. Louis, n.d.), right in the middle of the Biden Administration’s massive sell-off of oil from the Strategic Petroleum Reserve, which expanded the supply of oil on the market (Galbraith, 2023). This sequence of events seems more straightforward and plausible in explaining the 2022 disinflation.
It’s thus difficult to attribute 2022’s disinflation to monetary policy. There is no solid theoretical or empirical reason to believe that an interest rate hike could have increased oil supply (aside from small inventory drawdowns due to a higher cost-of-carry). Also, rate hikes may even contract oil supply by raising the cost of exploration and drilling.
The conventional narrative that aggressive monetary tightening successfully tamed post-pandemic inflation deserves scrutiny. Suppose inflation was primarily supply-driven—as the evidence suggests—and disinflation was caused by falling energy prices rather than the effects of monetary policy. In that case, central banks may be receiving undue credit for a problem that largely resolved itself through supply-side adjustments. Economists across ideological lines are increasingly scrutinizing the conventional wisdom about monetary policy and questioning its dominance as a macroeconomic policy tool (Enzinger et al., 2025; Cochrane, 2025). Understanding what caused and brought inflation down is not just an academic exercise—it informs how we'll respond to the next crisis.
References
Bank of England. (1999). The transmission mechanism of monetary policy. Bank of England Quarterly Bulletin, 39(2), 161–170. https://www.bankofengland.co.uk/-/media/boe/files/quarterly-bulletin/1999/the-transmission-mechanism-of-monetary-policy.pdf
Blinder, A. S. (2022). A monetary and fiscal history of the United States, 1961–2021. Princeton University Press.
Bounaim, F., Roc, J. G. J., & Zhang, Y. (2024). Sources of pandemic-era inflation in Canada: An application of the Bernanke and Blanchard model (Staff Analytical Note No. 2024-13). Bank of Canada. https://www.bankofcanada.ca/2024/06/staff-analytical-note-2024-13/
Cochrane, J. H. (2025, June 4). Maybe the price puzzle and NK model are right after all. The Grumpy Economist. https://www.grumpy-economist.com/p/maybe-the-price-puzzle-and-nk-model
Enzinger, M., Gechert, S., Heimberger, P., Prante, F., & Romero, D. F. (2025, August 18). The overstated effects of conventional monetary policy on output and prices (OSF Preprint). OSF. https://osf.io/preprints/osf/72cen_v2
Federal Reserve Bank of St. Louis. (n.d.). Crude oil prices: West Texas Intermediate (WTI) – Cushing, Oklahoma [Data set]. FRED, Federal Reserve Bank of St. Louis. Retrieved October 25, 2025, from https://fred.stlouisfed.org/series/DCOILWTICO
Federal Reserve Bank of St. Louis. (n.d.-a). ECB deposit facility rate for euro area [Data set]. FRED, Federal Reserve Bank of St. Louis. Retrieved October 25, 2025, from https://fred.stlouisfed.org/series/ECBDFR
Federal Reserve Bank of St. Louis. (n.d.-b). Federal funds effective rate [Data set]. FRED, Federal Reserve Bank of St. Louis. Retrieved October 25, 2025, from https://fred.stlouisfed.org/series/DFF
Federal Reserve Bank of St. Louis. (n.d.-c). Immediate rates: Less than 24 hours: Central bank rates for Canada [Data set]. FRED, Federal Reserve Bank of St. Louis. Retrieved October 25, 2025, from https://fred.stlouisfed.org/series/IRSTCB01CAM156N
Galbraith, J. K. (2023, March 20). The quasi-inflation of 2021-2022: A case of bad analysis and worse response. Institute for New Economic Thinking. https://www.ineteconomics.org/perspectives/blog/the-quasi-inflation-of-2021-2022-a-case-of-bad-analysis-and-worse-response
Macklem, T. (2023, February 7). Monetary policy at work [Speech]. Bank of Canada. https://www.bankofcanada.ca/2023/02/monetary-policy-at-work/
Mishkin, F. S. (1995). The channels of monetary transmission (NBER Working Paper No. 5464). National Bureau of Economic Research. https://www.nber.org/papers/w5464
Mui, P. (2022, August). A vacant metric: Why job openings are so unreliable. Employ America. https://www.employamerica.org/labor-market-analysis/a-vacant-metric-why-job-openings-are-so-unreliable/
Sahm, C. (2023, June 1). Inflation: It's "complicated." Stay-At-Home Macro. https://stayathomemacro.substack.com/p/inflation-its-complicated
Stiglitz, J. E., & Baker, D. (2022, July 8). Inflation dos and don'ts. Project Syndicate. https://www.project-syndicate.org/onpoint/us-inflation-supply-side-causes-and-solutions-by-joseph-e-stiglitz-and-dean-baker-2022-07